.jpg)
If you've already read one of our other articles comparing Netflix, Amazon Prime Video, and Disney+, feel free to skip the following introduction and read straight through to the "Perspicuity" section.
The three established video-on-demand (VoD) providers Netflix, Amazon Prime Video and Disney+ all basically promise the same thing: watch whatever you like best at any time. And yet the implementation in the details and thus the success of the providers are different. Netflix currently leads the way with around 208 million subscribers worldwide, followed by Amazon Prime Video with strong growth in 2020 and currently around 150 million subscribers. Still quite new to the market, the provider Disney+ can count 100 million subscribers worldwide (as of 24.06.2021).
Do the numbers of subscribers also reflect the user experience with the product? Why do we like Netflix better than Amazon Prime Video or the other way around? Are there specific things we can name or is it simply the big picture that convinces us more with one provider than the other? Most of the time, we can't put it exactly into words, or it's just a couple of good experiences with the one product that inspires a positive feeling in us. That's why we tried to put into numbers what differentiates Netflix, Amazon Prime Video and Disney+ from each other and present our findings here.
To measure quantitatively, we used the User Experience Questionnaire + (UEQ+). The UEQ measures user experience based on 6 scales. Each scale has opposing word pairs that describe the experience (eg. complicated - simple).
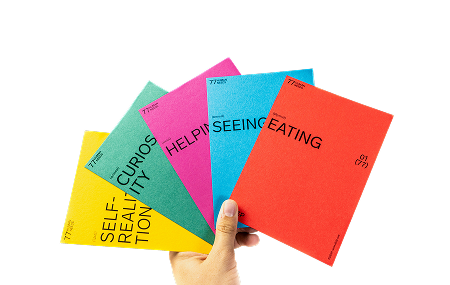
The UEQ+ is the modular version of the UEQ questionnaire and allows to choose from multiple scales. In this way, the survey can be better adapted to the respective product, since not all scales are suitable for all products. The respondents were asked exclusively about their experience with one of the three providers in relation to TV usage. Thus, the results only reflect the experience of TV usage; mobile and PC usage are not included. We asked more than 60 respondents to rate the following five scales, 20 respondents per provider:

The range of the scales is between -3 (terribly bad) and +3 (extremely good). Due to the calculation of mean values across different subjects with different opinions, it is extremely unlikely to observe values above +2 or below -2. In this article, I describe the evaluation of the perspicuity scale. The provider Amazon Prime Video scored best. You can find out why here.
Perspicuity
“Subjective impression of the users that it is easy to get familiar with the product.”
––––––

VOD services are now widespread and part of a digital lifestyle. Some providers have been on the market longer and are therefore more established. Nevertheless, there are users who have only recently registered with a VOD service. They must first familiarize themselves with the product and find their way around it.
Since user experiences are always subjectively influenced, perspicuity is also a subjective impression, which can, however, be described and measured using four pairs of adjectives:
The results of the test offer a lot of room for interpretation. However, a few (operating) elements can be identified that clearly serve to improve clarity. Both Netflix and Disney+ use a fixed vertical main navigation in their Smart TV app. Even when users navigate deep into the content structure, they always remain aware of which level of navigation they are on. With Amazon Prime Video, which uses a horizontal main navigation that disappears when scrolling, orientation could be much more difficult.
As mentioned in the blog article The importance of aesthetics for UX, a harmonious interplay of design elements is important. This includes the visual language, typography, animation and sound. In this respect, Amazon Prime Video keeps it plain and simple, which serves the transparency. Movie and series titles are written in a standard font, rather than in the branding of the content. The detail pages also appear tidier and easier to grasp thanks to a rather rigid design, i.e. clearer and less confusing.
From a subjective point of view, good personalization also makes a VOD service more transparent. If users can find the movie and series content where they expect it, this is understandable and comprehensible for them and makes it easier to use. Hours of browsing through endless lists become superfluous.
Regardless of whether it is difficult or easy for users to familiarize themselves with a VOD service, every second household now uses one of the paid services, and the trend is rising. In the end, the (partly exclusive) content of the respective VOD service is probably more decisive for signing up for a subscription. Often, people do not stay with just one provider, but use various services in parallel. McKinsey also states: "From the providers' point of view, the most attractive customers for new contracts are those households that already have streaming subscriptions. Thus, 27% of respondents subscribed to one streaming service, 16% to two services, and just under 10% to three or more services.
This blog article is part of the series "A quantitative comparison of the user experience of Netflix, Amazon Prime Video and Disney +". If you're interested in how the three providers scored on the other four scales, we'll link to the articles here.
Is dependability the determining factor?
The importance of aesthetics for UX
Further information and sources:
https://de.statista.com/statistik/daten/studie/196642/umfrage/abonnenten-von-netflix-quartalszahlen/ (last accessed on June 24th 2021)
https://t3n.de/news/amazon-hat-weltweit-150-millionen-1247966/ (last accessed on June 24th 2021)
https://de.statista.com/statistik/daten/studie/1186805/umfrage/abonnenten-von-disney-plus/ (last accessed on June 24th 2021)
https://www.mckinsey.de/news/presse/video-streaming-jeder-zweite-deutsche-haushalt-nutzt-netflix-amazon-prime - (last accessed on July 5th 2021)

.jpeg)


